Day 4 – Making Basic Interpretations
For this lesson, we take a stab at pulling some basic information out of 1,000 scenarios you created.
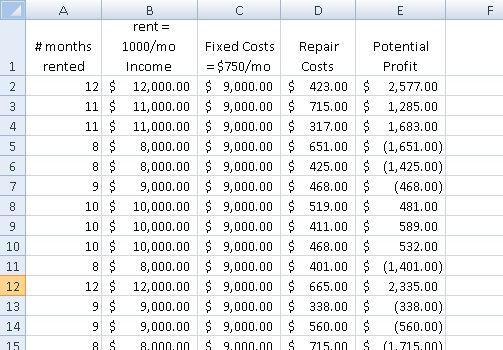
Step 1: Let’s revisit where we left off. You had just created a large data set.
Now it’s time to work with that “Potential Profit” column.
Step 2: Let’s determine the most likely profit this investment could yield by finding the median. Just use the MEDIAN(E1:E1001) function on the full range of potential profit estimates and it will issue an answer around $500. This means that half of the estimates are less than $500 (the median) and half are more.
Step 3: If you’re like me, you always want to know your chances of losing money in. So let me show you how to do that. Simply count the number of scenarios that have results less than $0.00. Used the COUNTIF(E1:E1001,”< 0″) function to do this.
It will tell you about 400 results out of 1,000 are less than $0. Meaning you should expect a 40% chance of loss. Now that’s good to know (and to share with your investors).
The main point: When you use the Monte Carlo Method, you’re truly able to determine a realistic profit as well as the odds of losing money. Let’s see your old back of the envelope calculations do that!
In tomorrow’s lesson I will show you how to extract some more advanced information from the data. OK, see you tomorrow.

