Day 5 – Making Basic Interpretations
For this wrap up lesson we’ll do some farming and learn how to harvest some great information from our scenarios.
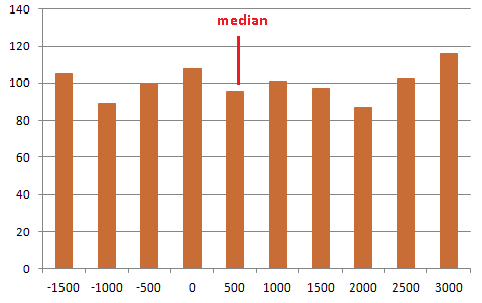
In the previous lesson, we learned that the median, the most likely estimate of potential profit was around $500 and we stood a 40% chance of not making any money at all.
Now let’s see what else we can learn.
Objective 1: Let’s find out what the maximum and minimum profit could be. To do that we’ll use the MAX(E1:E1001) and MIN(E1:E1001) functions. They will tell you the most you could expect to make is $2,775 but you also stand to loose up to -$1,800.
Objective 2: Use the COUNTIF function to determine the chance of making a specific profit. Just for kicks, let’s find the odds of making more than $2,340. By entering
COUNTIF(E1:E1001,”> $2,340″) we see that there is a 126 out of 1,000 chance (12.6%) that you can make that much.
Objective 3: Similarly, if we want to know the chance of losing more than $700, we would enter COUNTIF(E1:E1001,”< -$700“) and see find there’s a 221 out of 1,000 chance (22.1%) of losing that much.
The main point: Using the MAX, MIN, and COUNTIF functions help us pull a lot of information out our data with ease. Now we can have intelligent conversations about potential risk and rewards associated with an investment.
Congratulations!!! You completed the eCourse. I hope you understand the process well enough to use it in your everyday work. We’ll save the histogram graphing and fancy presentation options for another day.
Do you see how you can glean a ton of useful information with just a little additional work?
If you enjoyed this eCourse, please share it with a friend by sending them this link: https://leadinglandlord.com/real-estate-investor-monte-carlo-simulation/
Thank you

