Day 3 – Putting it in Excel
For this lesson, we’ll put our calibrated slot machine equation into Excel and create 1,000 trial outcomes to study.
Step 1: Let’s revisit our equation that uses calibrated slot machines to pick numbers for the “# month rented” during the year and possible “repair costs”.
Potential Profit = [r(8, 12) x monthly rent] – fixed expenses – r(220, 800)
The r(min, max) slot machine is really known as “random between” in spreadsheet language. So we’ll write r(8, 12) as RANDBETWEEN(8,12).
Note the abbreviated spelling of “random.” If you’re using Excel, they condensed it to “rand.”
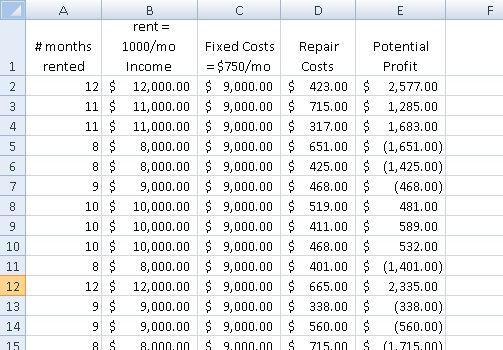
Step 2: Let set up your spreadsheet with the following header.

Here are the details:
For A2, # months rented => RANDBETWEEN(8, 12)
For B2, Income => # months rented x $1,000/month
For C2, Fixed Costs => $750/month x 12 months
For D2, Repair Costs => RANDBETWEEN(220, 800)
For E2, Potential Profit => B2-C2-D2
Step 3: Breathe!!!
Step 4: Copy this row, A2:E2, down 1,000 times. Your last line should be at row 1001.
Notice how the “calibrated slot machine” picks different numbers for “# months rented” and “repair costs.” All these permutations help you create valid estimates without your personal biases getting in the way.
The main point: You’ve just created a 1,000 profit estimates; a data set large enough to use basic statistics on with credibility. That’s impressive – good job!
In tomorrow’s lesson I’ll show you how to work with these results so they’re easy to understand.

