I sure hope you’re not like me when it comes to your rental’s coin op laundry room. I’ve been so focused on discovering 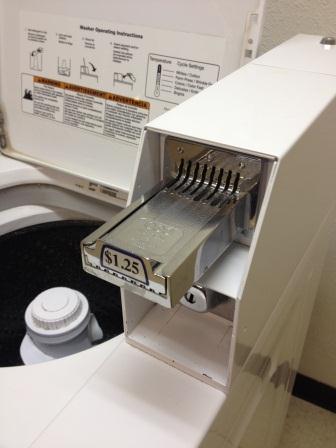 non-obvious income ideas that I neglected to see the full potential of my complex’s laundry mat.
My laundry room currently grosses $73.39 each month. But how much should it gross? Would it be worthwhile to invest in a renovation? I want to say “yes” and launch into a fun project, but I really should evaluate the profit potential first.
The best way I know to get a sober perspective on potential profit is to run Monte Carlo Simulations. I learned that lesson the hard way. Click HERE to learn how to create Monte Carlo Simulations.
I want you to be able to check your rental’s laundry room potential, so I’ll walk you through the steps:
Step 1: Write the equation.
Monthly Earnings = (Price/Load) * (Total Number of Loads/Week) * (4 Weeks/Month)
Step 2: Break out the variable.
- Price/Load: My tenants currently pay $3.25 to wash and dry a load of clothes.
- Total Number of Loads/Week: My tenants typically do zero or two loads per week. In Monte Carlos language, we want the computer to randomly assume 0, 1, or 2 values so we’ll write it like this => RandBetween(0,2). However, tenants that have children will likely do 1 to 4 loads each week. That would be written as RandBetween(1,4).
Step 3: Place those variable into a spreadsheet. For my eight unit building, the set up looks like this:
Monthly Earnings = ($3.25/load ) * ( Num Loads Apt 1 + Num Loads Apt 2 + …. Num Loads Apt 8) * (4 weeks/month)
Each tenant household does between zero and two loads each week, so I substitute in the RandBetween(0,2) function to represent this unpredictability. Then I totaled the random numbers to find the total number of loads per week. The spreadsheet set up looks like this:
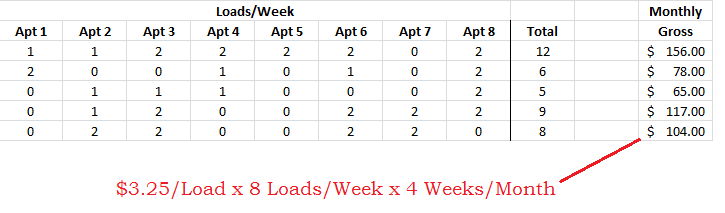
Step 4: Create 100 simulations by copying the row 100 times. I only show five lines in the picture above.
Step 5: Evaluate the monthly gross by using MAX and MEDIAN functions.
Max = $182 is the realistic maximum amount I should expect.
Now if I hadn’t used a Monte Carlo technique, I would have mistakenly guessed $208 ($3.25 x 16 x 4) was the max. I could have gotten burned by making a decisions based on an inflated value.
So here’s the lesson: If you hate loosing money, then run Monte Carlos.
Median = $104 is the benchmark. I’m currently not earning this much, therefore something in my laundry facility needs correcting.
Step 6: Make a comparison. If I were earning the $104 per month, the median gross, that would mean I earned a C grade. But since I’m averaging $73.39 per month (and $91.88 at best), I’m earning an D grade. Clearly, I need to make some improvements.
Is Your Laundry Room Profit Center Up to Snuff?
Modify the equations to match your complex’s washer and dryer prices, number of units, and number of loads/week. Find your own median and see how you compare.
Please leave a comment below and tell me what you find.